Full visibility of your cash flow, across every bank, every company, and every currency
Fonder consolidates all your banks and business entities, projects your cash flow day by day, and alerts you when the projection deviates. In your local currency and in US dollars.
Everything Fonder does with your cash register, module by module

Banking connectivity: all your banks on a single screen
Balances are updated automatically, both in your local currency and their USD equivalent. No exporting needed, and no need to request statements by email.
Fonder connects with all banks in Argentina, Chile, and Peru, and with the major ones in Mexico, Colombia, and the United States. In Argentina, we are an official partner of Interbanking, which enables real-time balances and transactions.
Forget about manual imports: connect your ERP —Odoo, Tango, Bejerman, SAP, NetSuite, Siigo, or whichever one you use— and add Mercado Pago, payment gateways, and your cash registers to the same consolidated position.
Cash flow forecasting: anticipate your cash flow day by day
What has already happened in the bank and what is to come, on the same timeline. Upcoming invoices and uploaded estimates, on top of the actual balance.
Forecasts that improve with each cycle and detect deviations before they occur
Generate forecasts that reflect actual business activity, not static assumptions on a spreadsheet. Projections are updated as new data arrives from the ERP, variances are detected the moment they occur, and account-level projections anticipate potential overdrafts before they happen.

Breakdown by category, with collapsible collections and payments
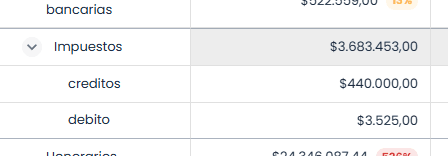
You open any period and see what it is made of: what collections support it and what payments consume it.
Beginning balance of the period in each column
Each column starts with your opening balance, so you don't have to rely on mental math to keep track of the accumulated total.

Alert when projection deviates
If actuals deviate from projections, Fonder flags it for you instantly, not at the end of the month.

Upload your forecasts and let them automatically reconcile against the bank
Salaries, payroll taxes, and taxes don't have receipts, but they still go out. Upload them once, and Fonder matches each forecast with its actual transaction.
Reconciliation
Line-by-line forecast reconciliation
Each forecast you uploaded is matched with the transaction that fulfilled it. You can see which one was met, which one was rescheduled, and which one never arrived.

Control
Project cash flows automatically, even when historical data is missing
Categories without a data source are automatically identified, and projections are generated based on historical patterns. Adjust them whenever you need to: each correction is incorporated to keep future estimates aligned with reality.

Learning
Fill the gaps in your cash flow with forecasts based on historical patterns
Periods without coverage in your forecasts are continuously identified. When one is detected, a forecast based on your historical data is suggested so that your cash flow view is always complete and ready for decision-making.

Multi-horizon management: from day-to-day to monthly reporting
The same data across three horizons. The daily one to operate the week, the monthly one for the conversation with the board of directors.
Daily, weekly, and monthly view
The daily to trade the week, the weekly to anticipate the squeeze, the monthly for the conversation with the board of directors.
The same data, without rebuilding anything
You change perspective and the information reorganizes itself. There are no longer three spreadsheets to keep synchronized.
Filter by company, bank, or project
You can look at the entire group or drill down to a single corporate entity, bank, or project, all within the same view.
Projection through the end of the month
See what balance you will reach at the end of the month with what is already loaded, without waiting for the month to pass.
Dashboards and reporting: the entire month on one screen
You choose the company and the month, and the dashboard automatically puts together what comes in, what goes out, and your closing balance.
Accounts receivable, accounts payable, and projected ending balance
The three numbers you start the month with. If the closing balance is negative, you see it on the 1st instead of the 30th.
Income and expenses week by week
The five weeks of the month in bars, with the balance curve next to it. You see exactly in which week your cash flow turns around.
Late collections and payments, with DSO and DPO
How much you are owed and how much you owe, with pending transactions factored in and the average collection and payment days for the period.
Expenses by classification and margin of the month
Where the money goes: taxes, partners, social security. Plus sales, purchases, and net profit, based on the issue date.
